eProtein Quantification Kit Protocol
General Information
The Quantification Kit (NC3014) allows the user to accurately quantify protein yields immediately after scale up using the same fluorescence-based method used on-cartridge. Same system, same workflow, consistent results.
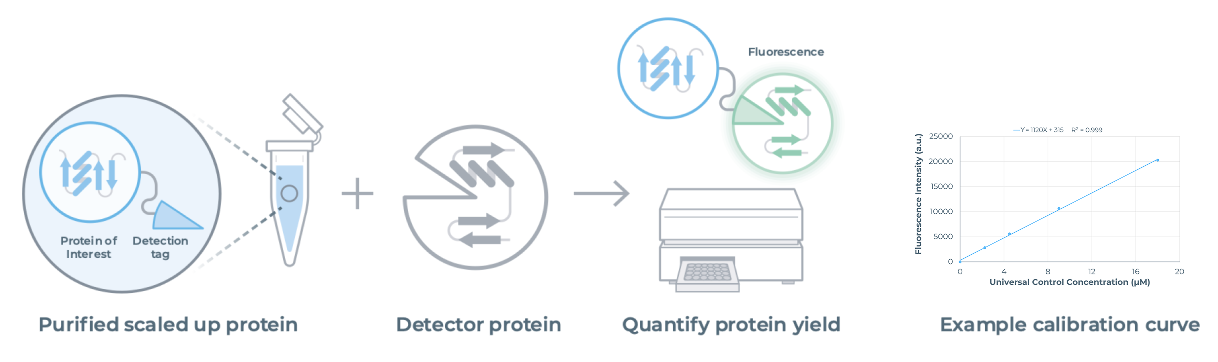
Compatible with standard plate readers, the detection tag on your scaled-up protein binds to a complementary detector protein, generating a fluorescent signal calibrated to a universal control.
Features and benefits
Scalable: Consistent workflow, from screen to scale. Plate reader compatible
Accurate: Sensitive fluorescence-based detection ensures accuracy
Streamilined: Eliminates extra prep or method transfers. Scale up ready
Contents
| Component | Volume | Cap Color | Storage Temperature | Tube Reference number |
|---|---|---|---|---|
| Detector Protein | 75 µL | Yellow | -80°C | NQK-01 |
| Universal Control | 20 µL | Yellow | -80°C | NQK-02 |
| Complementation Control | 20 µL | Yellow | -80°C | NQK-03 |
| Wash Buffer | 800 µL | White | -80°C | NQK-04 |
User supplied equipment
▷ Microcentrifuge tubes (9)
▷ Your Proteins of interest (up to 5)
▷ Microplate reader capable of measuring fluorescence at Ex/Em = 485/520.
▷ Adhesive PCR plate seal.
▷ Fluorescence assay-compatible microplate (e.g. Corning, 3544) with the following specifications:
- 384-well
- Low volume (50 µL)
- Black walls with clear bottom
- Flat bottom
- Polystyrene with a nonbinding surface
Storage and Stability
▷ The kit must be stored at −80°C.
▷ Avoid freeze-thaw cycles.
▷ Thaw reagents on ice, briefly centrifuge, and pipette mix prior to use.
▷ Reactions should be assembled on ice.
Reaction Assembly Overview
| Standard Curve | Negative Control | Positive Control | Protein Samples | |
|---|---|---|---|---|
| Standard curve Master Mix | 8 µL | X | X | X |
| Standard Control Samples | 4 µL | X | X | X |
| Master Mix | X | 8 µL | 8 µL | 8 µL |
| Protein Sample | X | X | X | 4 µL |
| Control Sample | X | 4 µL | 4 µL | X |
| Total per Well | 12 µL | 12 µL | 12 µL | 12 µL |
Preparation of Standard Curve Reactions
- Prepare a fresh set of standards for each quantification experiment.
- When performing serial dilution of the Universal Controls, pipette up and down 5 times to mix the reagents.
- Use a fresh pipette tip for each dilution step.
- Each dilution provides enough standard to set up triplicate readings.
- Prepare the serial dilution according to the table below:
| Standard Curve Dilution Number | Concentration | Volume of Control | Volume of Wash Buffer |
|---|---|---|---|
| 1 | 18 µM | 15 µL of Universal Control | 15 µL |
| 2 | 9 µM | 15 µL of Dilution Number 1 | 15 µL |
| 3 | 4.5 µM | 15 µL of Dilution Number 2 | 15 µL |
| 4 | 2.25 µM | 15 µL of Dilution Number 3 | 15 µL |
| 5 | 0 µM | 0 µL | 15 µL |
- Add 128 µL of Wash Buffer to a separate a microcentrifuge tube labeled Standard Curve Master Mix.
Preparation of Control Reactions and Samples
- Prepare a new microcentrifuge tube labeled Master Mix according to the number of proteins samples you are interested in testing based on the table below:
| Number of Protein Samples | 1 | 2 | 3 | 4 | 5 |
|---|---|---|---|---|---|
| Detector Protein | 30 µL | 39 µL | 48 µL | 57 µL | 66 µL |
| Wash Buffer | 50 µL | 65 µL | 80 µL | 95 µL | 110 µL |
- To a new microcentrifuge tube, add 16 µL of Wash Buffer. Label this tube as Negative Control.
- To a new microcentrifuge tube, add 4 µL of Complementation Control and 12 µL of Wash Buffer. Mix well and label this tube as Positive Control.
- For each protein sample, ensure that there is at least 12-15 µL available for the assay.
- Proteins with a predicted yield of more than 18 µM on the eProtein Discovery™ should be diluted with Wash Buffer to ensure they fall below the maximum limit of detection.
Assay Plate Layout Overview
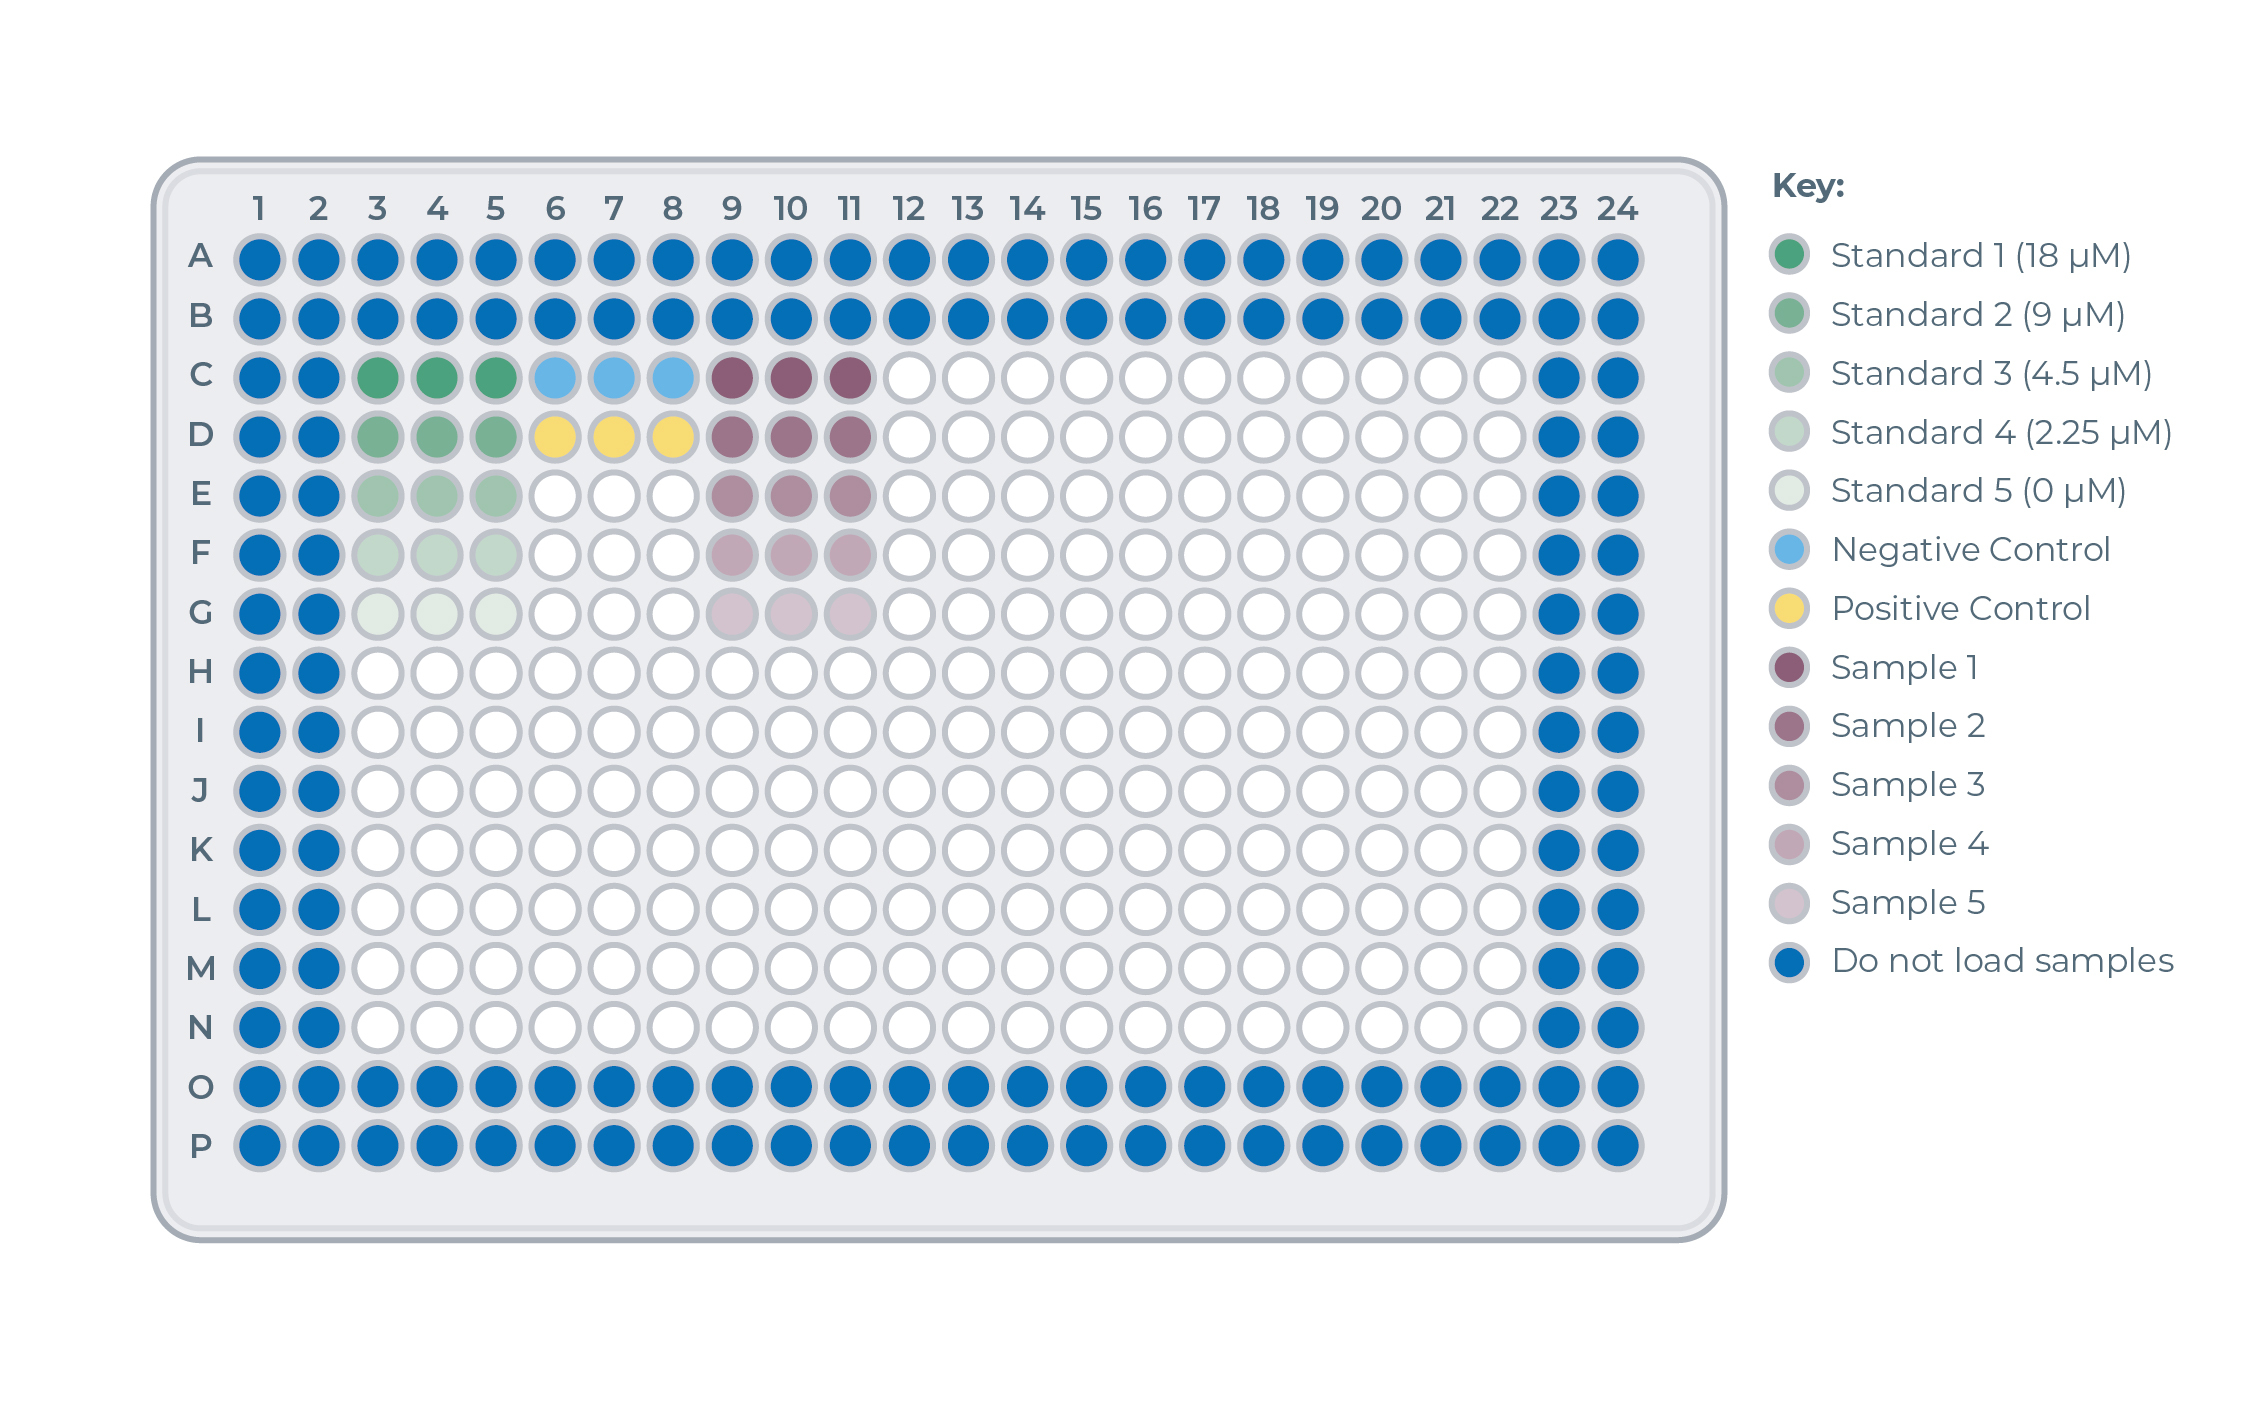
Loading of Standard Curve Reactions onthe the plate (green samples)
- For each of the five Standard Curve reactions, add 8 µL of Standard Curve Master Mix in triplicate to the assay plate, for a total of 15 wells.
- For all five Standard Curve Dilutions, add 4 µL of the sample to the wells containing Standard Curve Master Mix. Mix well.
Loading of Control Reactions onthe the plate (blue and yellow samples)
- For both the positive and negative control, add 8 µL of Master Mix in triplicate to the assay plate, for a total of 6 wells.
- For both controls, add 4 µL of the control samples to 3 wells containing Master Mix. Mix well.
Loading of Protein Sample Reactions onthe the plate (purple samples)
- For each protein sample, add 8 µL of Master Mix in triplicate to the assay plate.
- For each protein sample, add 4 µL of the relevant samples to 3 wells containing Master Mix. Mix well.
Incubation
- Seal the assay plate with an adhesive PCR plate seal. Ensure the plate is fully sealed before proceeding.
- Briefly vortex the plate and pulse centrifuge for 15 secs.
- Incubate the assay plate for 5 hours at 29°C.
- For overnight quantification, the assay plate can be incubated at 29°C directly in the plate reader with the program set to measure fluorescence after 5 hours. Ensure that the plate seal is left on and the program is set to bottom reading mode.
Measurement
- After 5 hours measure the fluorescence of all standards, controls, and samples in a plate reader with a 485 nm excitation filter and a 520 nm emission filter.
Data Analysis
- Calculate the average fluorescence reading for each standard.
- Subtract the 0 µM reading from all other standard readings.
- Plot the µM concentration of each standard against the measured fluorescence intensity, fit a linear trendline, and set the intercept to 0.
- Calculate the average fluorescence intensity for each set of controls and protein samples.
- Subtract the average fluorescence reading for the negative control from the positive control and protein sample measurements. The expected concentration of the positive control is approximately 9.0 µM.
- Use the linear trendline equation to calculate the molarity of the protein samples and positive control.
- If the protein was diluted prior to reaction assembly (e.g. if the predicted concentration was above 18 µM), multiply by the dilution factor to calculate the concentration of the original sample.
Nuclera Technical Support:
UK Phone: +44 1223 942 761
US Phone: +1 508-306-1297
Email: techsupport@nuclera.com
Nuclera Customer Service
UK phone: +44 (0) 1223 974 975
US phone: +1 508-306-1849
email: care@nuclera.com
Offices:
Nuclera UK (HQ):
One Vision Park, Station Road, Cambridge, CB24 9NP, UK
Nuclera USA:
1000 Technology Park Drive, Suite B, Billerica MA 01821, USA
Copyright © 2025 Nuclera Ltd. All trademarks are the property of Nuclera, Ltd. Visit nuclera.com/legal for more info.